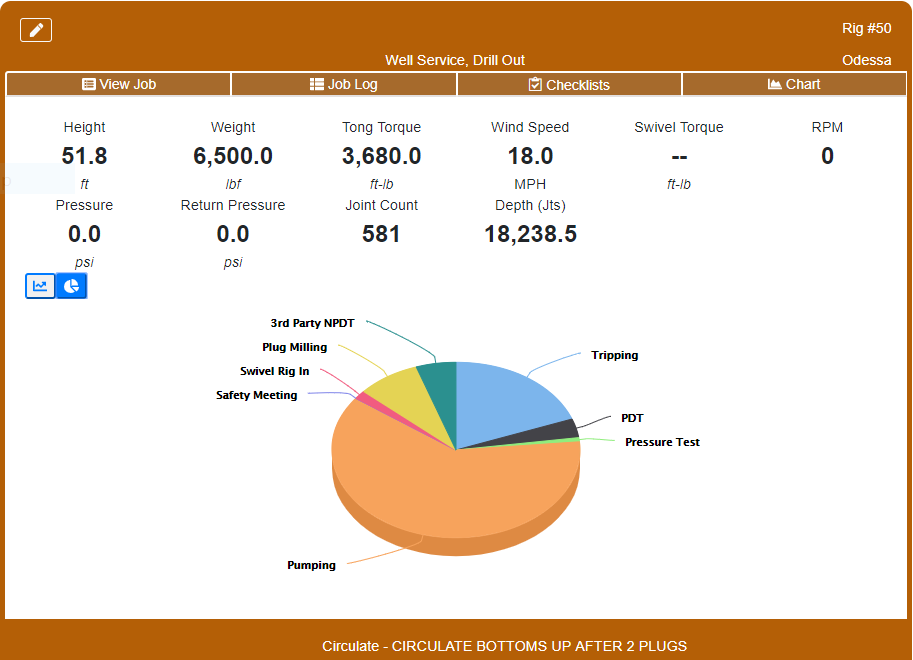
Did you know that through CORE’s software dashboard, graphs are built in real time as the job proceeds? These KPI reports, which users can view from any location on any web-enabled device, give a quick status at a glance of the overall job health: http://bit.ly/3cAaVuU.
Analysis of each job is done both in real time on a plug-by-plug basis and in a detailed post-job report. This overall view gives operators a snapshot of everything that is happening at a particular well in real time, including weight, depth, torque, RPM, average running speed, and plug times.
Current customers have commented on the advantage of “utilizing the Axis modeling option combined with CORE data to do a pre- and post-job performance analysis” to tie in with their KPI reports.
With CORE, you do not have to visit the well site to know what is happening second by second. With real-time data and automatic KPI reports, the data is at your fingertips for review, analysis, and control.
Please contact us for a demonstration of this revolutionary digital system and let us show you the Axis difference!
Contact:
Erik Coleman
Vice President of Sales
(432) 999-8716
Erik.Coleman@axisofs.com


Share This Article